This article was originally published on ALEX Chatter: A Look at the Most and Least Expensive Multifamily Investment Markets.
-----
As we enter the fall buying season, it’s useful to look at pricing in major multifamily markets through the first half of the year. Not only in the priciest markets, but also in markets that may represent higher yield opportunities.
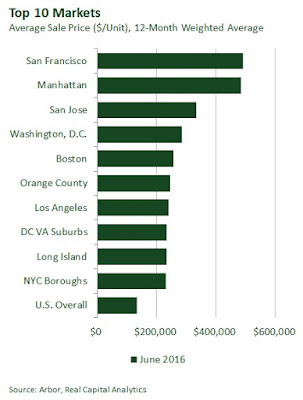
Using transaction data compiled by Real Capital Analytics, we calculated the average sale price in the top 50 markets in the U.S. – specifically, the weighted average price per unit paid for apartment sales transactions over $2.5 million recorded during the 12 months ending in June 2016. The average price for the U.S. overall during that time was $134,000/unit.
Most Expensive Markets
San Francisco ($492,500/unit) was the highest priced multifamily investment market over the last 12 months. Its local economy has been boosted by the expansion of the technology sector, while opposition to new development has limited new supply. Given those attributes, San Francisco should remain among the more favored markets in the long term.
Manhattan ($485,800/unit) was second on the list, weighted heavily by the purchase of Stuyvesant Town and Peter Cooper Village for $5.3 billion at the end of last year. New York City remains the favorite destination for international investment capital. However, investors of all types have begun to approach this market with caution as the luxury condominium market has slowed recently. The area also now has the highest level of new development in the pipeline of any multifamily market in the country.
The third highest priced multifamily investment markets was also in the Bay Area: San Jose ($334,800/unit). Boosted by a strong local economy built around Silicon Valley’s entrepreneurial spirit, San Jose’s long-term forecast remains bright.
Washington, D.C. ($284,500/unit) and Boston ($257,200/unit), two additional traditional international gateway investment markets, rounded out the top five highest priced markets.
Least Expensive Markets
It’s also useful to look at recent sales transactions in the lowest priced multifamily markets, to see where high-yield opportunities may lie.
“The secondary and tertiary markets of the U.S. have apartment assets that price at a lower rate per unit and also at higher cap rates,” said Jim Costello, Senior Vice President at Real Capital Analytics. “In the six major metros, cap rates came in at 4.8% in during Q2 2016 versus a 6.4% rate in the secondary and tertiary markets. Given that GSE debt is priced about the same across markets in terms of mortgage rates, it implies more positive leverage opportunities in the secondary and tertiary markets.”
The lowest priced market over the last 12 months was Memphis ($54,600/unit). Memphis is expected to maintain strong economic growth as a major transportation hub with a healthy job market, low business costs, and an attractive downtown area.
Indianapolis ($57,600/unit) was another strong market that finished at the bottom of the list. The local economy is expected to continue its recent expansion, which has been driven by low business costs and favorable demographics, along with gains in employment in the high-tech and life sciences sectors.
Three Ohio markets, Cleveland ($59,600/unit), Columbus ($63,100/unit), and Cincinnati ($77,300/unit) were among the lower priced markets. Data from Real Capital Analytics shows that the average apartment cap rate in Ohio came in at 7.6% in during Q2 2016. The local economy in these markets should continue to pick up steam in the near term, based on strong growth of healthcare and professional services sectors.
Houston ($73,700/unit), where the local economy has been hurt by falling energy prices, rounded out the top five lowest priced markets.

