Showing posts with label Manhattan. Show all posts

Thursday, January 30, 2020

Top U.S. Multifamily Markets of the Decade


This article was originally published on Arbor Chatter: Top U.S. Multifamily Markets of the Decade, and all charts and images are from Arbor Chatter.


-----

  • The 2010s solidified the multifamily market's recognition as a premier asset class.
  • Manhattan was the leader for multifamily investment, with $74.5 billion in transactions from 2010 to 2019.
  • Markets in the Sun Belt became hot spots for capital over the decade, including standout cities like Atlanta.
-----

The 2010s decade began in the wake of one of the deepest housing downturns the country had ever seen, amid a global financial crisis, and ended with uncertainties surrounding a trade war with China and accelerated climate change.

There was also a massive demographic shift previously unseen in the country. Baby boomers entered into retirement and millennials came of age.

Over the course of the decade, the multifamily real estate market emerged as a premier asset class. Demand was driven not only by the shifting demographics, but also housing affordability issues surrounding escalating prices, limited supply and stagnant wage growth.

Real Capital Analytics (RCA) recently dubbed the 2010s a “fantastic” decade for the U.S. commercial real estate market overall, as the national RCA CPPI for all property types increased 103% over the last 10 years. The multifamily segment of the index measured an especially successful run, increasing more than 160%, by far the highest of the four major property sectors.

RCA reported a total of $1.2 trillion in transaction volume during the decade, setting record numbers nearly every year. The average sales price increased from $77,900/unit during 2010 to $176,000/unit during 2019, while the average cap rate fell from 6.8% to 5.4%. The top destinations for capital investment were among the largest markets in the country, but a closer look at the data reveals each market’s individual performance.


Manhattan Takes the Top Spot for Multifamily Investment

The Manhattan market led the U.S. with a total of $74.5 billion in multifamily transactions recorded from 2010 through 2019. Manhattan was the nation’s second most expensive market (behind only San Francisco), finishing the decade with an average sale price of $437,400/unit, as compared with $195,900/unit during 2010. Manhattan also finished with the second lowest average cap rate, which declined from 5.6% to 4.4%, again trailing only San Francisco.

Additionally, New York City’s outer boroughs also made the top rankings, with $39.3 billion in volume and prices increasing from $102,200/unit to $237,700/unit.

Demand in the New York area was driven by a tight labor market and strong local economy, including the explosion of the technology sector. Going into the next decade, investors will be keeping an eye on the slowdown in the financial services sector, as well as the stagnant housing market and increasing out-migration.

Dallas Investment Ramps Up in Second Half of the Decade
Dallas was number two on the list, with a total of $68.8 billion in sales. The market dominated the second half of the decade, leading all markets with more than $48.3 billion in sales. The average multifamily sales price finished at $128,500/unit and the cap rate was 7.3%.

Employment in Dallas increased by 35% during the decade, an outstanding rate of growth given the extremely large size of the metro area, adding more than 720,000 jobs. The area’s strong financial services industry and position as a distribution hub, as well as strong population growth and positive migration trends, will continue to drive multifamily demand in the 2020s.

Decade for Los Angeles Characterized By High Housing Costs
Los Angeles finished just behind Dallas, at $65.1 billion. The decade for L.A. was characterized by high prices (finishing at $292,700/unit) and low cap rates (falling from 5.6% to 4.6%), with both trailing only Manhattan among the top markets during 2019.

During the decade, the Los Angeles metro area added nearly 690,000 jobs, representing a 17% growth rate. While a considerable total number of jobs, the growth rate was in line with the national average. The healthcare and construction sectors are expected to remain significant drivers of employment in the area, and high housing costs should continue to solidify rentership demand.

Sun Belt Becomes Top Destination for Capital
Sun Belt markets performed especially well during the expansion. In addition to Dallas, Atlanta ($56.7 billion) and Houston ($47.9 billion) ranked high as top destinations of capital. Atlanta had the highest cap rates among the top markets at the beginning of the decade, at 7.7%, although a strong improvement in occupancy helped depress the cap rate to 5.6% by decade end.

Prices in Houston increased 185%, with cap rates falling from 7.5% to 5.4%, driven by the market’s emerging tech scene. The area’s low taxes and affordable land prices will continue to foster a favorable multifamily investment market.


Austin rounded out the list, with $28.7 billion in multifamily transactions recorded. Austin had the top employment growth rate among large markets during the decade at more than 43%, adding 335,000 jobs.

Western Markets See Strong Price Increases
Some growing western markets where residents went to escape the expensive Bay Area also ranked highly, including Seattle with $40.9 billion in sales. Seattle started the decade with one of the lowest average cap rates in the nation at 5.7%, which declined to 5.0% for 2019.

Phoenix and Denver finished the decade in the same spot, with each falling just shy of $40 billion. Phoenix saw the second-highest price growth in the nation during the decade (trailing only Las Vegas), with the average sales price rising to $157,200/unit from $45,400/unit, an increase of nearly 250%. Prices in Denver also showed a strong increase of nearly 200%, finishing at $219,400/unit.

Thursday, September 8, 2016

A Look at the Most and Least Expensive Multifamily Investment Markets


This article was originally published on ALEX Chatter: A Look at the Most and Least Expensive Multifamily Investment Markets.

-----

As we enter the fall buying season, it’s useful to look at pricing in major multifamily markets through the first half of the year. Not only in the priciest markets, but also in markets that may represent higher yield opportunities.

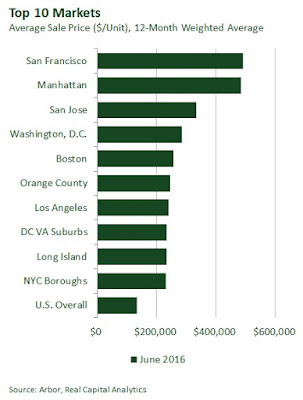
Using transaction data compiled by Real Capital Analytics, we calculated the average sale price in the top 50 markets in the U.S. – specifically, the weighted average price per unit paid for apartment sales transactions over $2.5 million recorded during the 12 months ending in June 2016. The average price for the U.S. overall during that time was $134,000/unit.

Most Expensive Markets

San Francisco ($492,500/unit) was the highest priced multifamily investment market over the last 12 months. Its local economy has been boosted by the expansion of the technology sector, while opposition to new development has limited new supply. Given those attributes, San Francisco should remain among the more favored markets in the long term.

Manhattan ($485,800/unit) was second on the list, weighted heavily by the purchase of Stuyvesant Town and Peter Cooper Village for $5.3 billion at the end of last year. New York City remains the favorite destination for international investment capital. However, investors of all types have begun to approach this market with caution as the luxury condominium market has slowed recently. The area also now has the highest level of new development in the pipeline of any multifamily market in the country.

The third highest priced multifamily investment markets was also in the Bay Area: San Jose ($334,800/unit). Boosted by a strong local economy built around Silicon Valley’s entrepreneurial spirit, San Jose’s long-term forecast remains bright.

Washington, D.C. ($284,500/unit) and Boston ($257,200/unit), two additional traditional international gateway investment markets, rounded out the top five highest priced markets.


Least Expensive Markets

It’s also useful to look at recent sales transactions in the lowest priced multifamily markets, to see where high-yield opportunities may lie.

“The secondary and tertiary markets of the U.S. have apartment assets that price at a lower rate per unit and also at higher cap rates,” said Jim Costello, Senior Vice President at Real Capital Analytics. “In the six major metros, cap rates came in at 4.8% in during Q2 2016 versus a 6.4% rate in the secondary and tertiary markets. Given that GSE debt is priced about the same across markets in terms of mortgage rates, it implies more positive leverage opportunities in the secondary and tertiary markets.”

The lowest priced market over the last 12 months was Memphis ($54,600/unit). Memphis is expected to maintain strong economic growth as a major transportation hub with a healthy job market, low business costs, and an attractive downtown area.

Indianapolis ($57,600/unit) was another strong market that finished at the bottom of the list. The local economy is expected to continue its recent expansion, which has been driven by low business costs and favorable demographics, along with gains in employment in the high-tech and life sciences sectors.

Three Ohio markets, Cleveland ($59,600/unit), Columbus ($63,100/unit), and Cincinnati ($77,300/unit) were among the lower priced markets. Data from Real Capital Analytics shows that the average apartment cap rate in Ohio came in at 7.6% in during Q2 2016. The local economy in these markets should continue to pick up steam in the near term, based on strong growth of healthcare and professional services sectors.

Houston ($73,700/unit), where the local economy has been hurt by falling energy prices, rounded out the top five lowest priced markets.


Friday, April 8, 2016

In Case You Missed It: Week of April 4, 2016

Manhattan rents drop for first time in 2 years
The Real Deal
April 7, 2016
“For the first time in two years, the median residential rental price has decreased in the borough, according to a new report by Douglas Elliman. The median rent in March dropped to $3,300, a 2.8 percent decrease from March 2015. Over the last few months, the rate of price growth slowed, preluding a rental flatline.”

U.S. Apartment Market Shows Signs of Losing Steam
The Wall Street Journal ($)
April 7, 2016
“The apartment-rental market cooled in the first quarter, according to reports from three research companies, suggesting a six-year boom that has pushed the cost of housing to unaffordable heights in many U.S. cities might be coming to an end.”

Rogue One: A Star Wars Story (2016) Teaser Trailer
Trailer Addict
April 07, 2016
“Rogue One is about a group of rebels who set out on a mission to steal the plans for the Death Star. This is only the first teaser, so don't expect too much to be revealed, but they do show quite a bit and it looks amazing.”

Experts warn affordable housing rules will hurt development 
The New York Post
April 5, 2016
“The City Council and Mayor de Blasio can high-five all they want, but real estate experts believe the new Mandatory Inclusionary Housing (MIH) policies that require affordable units to be interspersed throughout buildings — while so far, not providing any real estate tax breaks in return for the lower rents — will put a damper on development.”

Will Rising U.S. Debt Levels Keep the Fed On Hold?
Charles Schwab
April 4, 2016
“The national debt factors into the Fed’s decisions only insofar as it affects the economy and inflation. Otherwise, fiscal policy is in the hands of Congress. So, what do the debt dynamics look like? The Congressional Budget Office (CBO) compiles a lot of useful data on this topic. It recently released its updated 10-year projections for the country’s financial outlook. The report is available online here, and we’ll take a closer look at some of the numbers below.”

Bryce Harper wore a 'Make Baseball Fun Again' hat after the Nationals' win
USA Today | For The Win
April 4, 2016
“Harper has been outspoken in his dissatisfaction with baseball’s unwritten rules. He wants players to express themselves and have fun on the field. He is in favor of the bat flip, and bat flips are awesome. Harper 2016.”

MAP: The Ramones' New York
DNAinfo
April 3, 2016
“The Queens Museum is about to unveil its tribute exhibit, "Hey! Ho! Let's Go: Ramones and the Birth of Punk" on April 10 — honoring the band's deep roots in the borough. But before Joey, Johnny, Dee Dee and Tommy Ramone — and later Marky, Richie, Elvis and CJ — took the world by storm, they got their start in Forest Hills. The original bandmates lived on Yellowstone Boulevard and wreaked havoc on Queens Boulevard, connecting at Forest Hills High School.”

Thursday, February 4, 2016

Foreign Investment in U.S. Multifamily Hits New Highs

"According to the latest data from Real Capital Analytics, foreign investment volume in U.S. multifamily properties totaled $16.3 billion during 2015 — nearly triple the 2014 total of $5.7 billion.

Foreign investment in the U.S. is expected to increase even further during 2016, in part driven by changes to the Foreign Investment in Real Property Tax Act (FIRPTA) enacted in December. The changes reduce tax obligations for non-U.S. investors investing in U.S. real estate."

Full Article: ALEX Chatter

Sunday, July 20, 2014

Midtown South Rents Close in on Midtown's

Midtown south's rent growth of 13% per year from 2010 to 2013 is similar to past spikes in 2000 and 2008, but today's high prices are being driven by changes within the district, particularly a stronger and more stable technology industry, according to CBRE. Tech tenants including AppNexus, Twitter and IBM Watson have increased their footprints in the area by 3.9 million square feet between 2007 and 2013.
"Occupancy is much higher now than it was at the previous peak, and they've taken up a larger share of leasing activity," said Matt Maison, manager of research and analysis for CBRE. "The tech industry overall is stronger overall, not only in midtown south."

Read the full article here: Midtown south rents close in on midtown's